penguinTrace allows you to see the instructions that code compiles down to and see how they get executed in order to run a program.
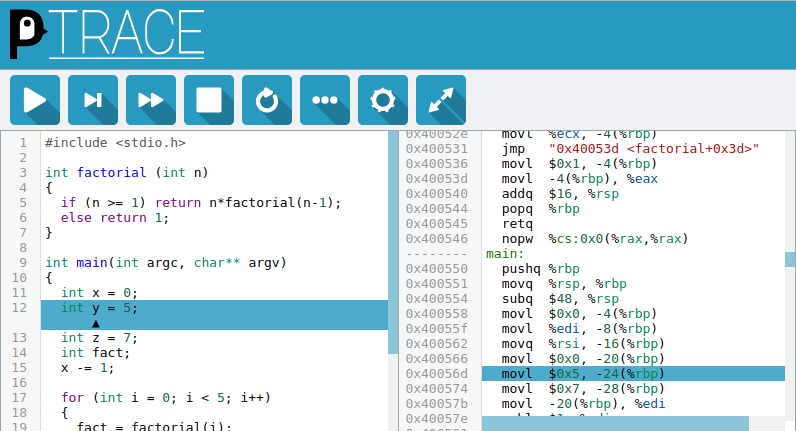
penguinTrace starts a web-server, and then code can be entered into the web interface. After compiling the code (▶), the interface will show the source code on the left and the assembly on the right. The current line of code will be highlighted on both sides.
The code can then be stepped through by instruction (▶) or line (▶|), and the ‘More Details’ (⋯) window shows the contents of the registers, variables in the current scope and the current stack.
